The psychrometric chart is a powerful tool used extensively in HVAC (Heating, Ventilation, and Air Conditioning) to analyze air properties and optimize indoor air quality. Understanding how to read and interpret this chart can significantly improve your skills in humidity control, energy efficiency, and indoor air quality management.
In this guide, we’ll cover everything you need to know about the psychrometric chart, including its components, how to read it, and practical applications. We’ll also provide helpful tips, hacks, FAQs, and a free downloadable resource to enhance your learning experience.
What Is a Psychrometric Chart?
A psychrometric chart is a graphical representation of the physical and thermal properties of moist air. It displays the relationships between:
- Temperature (dry bulb and wet bulb)
- Humidity (relative and specific)
- Sensible and latent heat
- Enthalpy
- Dew point
- Vapor pressure
Why Is It Important?
Understanding the psychrometric chart helps you design efficient HVAC systems, ensure thermal comfort, and improve humidity control. It’s essential for applications like:
- Dehumidification and humidification
- Energy recovery systems
- Indoor air quality management
Components of a Psychrometric Chart
Here are the key elements of a psychrometric chart:
1. Dry Bulb Temperature (DBT):
- Represented on the horizontal axis.
- Measured in degrees Fahrenheit (°F) or Celsius (°C).
2. Humidity Ratio (HR):
- Represented on the vertical axis.
- Measured in pounds of water per pound of dry air.
3. Relative Humidity (RH):
- Shown as curved lines.
- Indicates the ratio of actual water vapor to the maximum water vapor the air can hold at a given temperature.
4. Wet Bulb Temperature (WBT):
- Represented as diagonal lines sloping downward.
- Indicates the temperature air reaches when cooled to saturation.
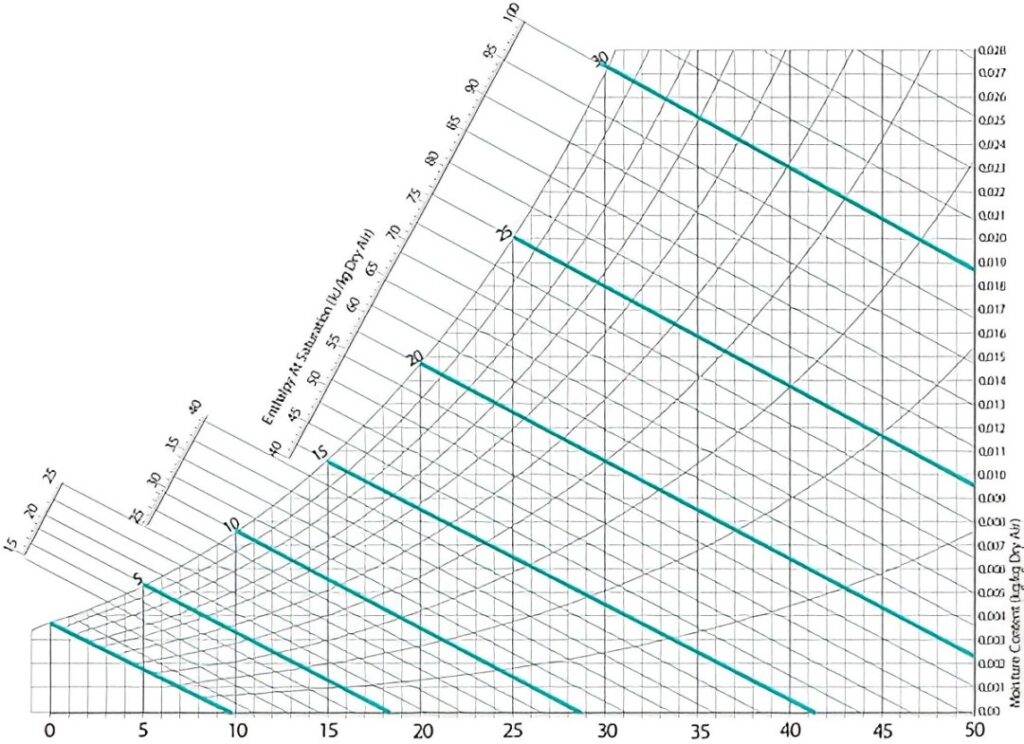
5. Enthalpy (h):
- Represented as diagonal lines sloping upward.
- Indicates the total heat content of air (BTU/lb or kJ/kg).
6. Dew Point Temperature (DPT):
- A horizontal line where air becomes saturated.
- Key for determining condensation.
How to Read a Psychrometric Chart
Step-by-Step Process:
- Identify the Dry Bulb Temperature (DBT): Locate the value along the horizontal axis.
- Find the Relative Humidity (RH): Trace the curved line corresponding to the desired RH.
- Determine the Humidity Ratio (HR): Follow the vertical axis to find the corresponding HR.
- Check the Wet Bulb Temperature (WBT): Move along the sloped diagonal line from the DBT point.
- Calculate Enthalpy (h): Use the diagonal lines sloping upward to determine the total heat content.
Practical Applications
1. Humidity Control
- Use the chart to determine how much moisture needs to be added or removed.
2. Energy Efficiency
- Optimize cooling and heating loads by analyzing air properties.
3. Indoor Air Quality (IAQ):
- Maintain proper RH levels (40-60%) to ensure comfort and health.
Key Formulas You Should Know
Sensible Heat:
- Q_s = Sensible heat (BTU/hr)
- CFM = Airflow rate (cubic feet per minute)
- = Temperature difference (°F)
Latent Heat:
- Q l = Latent heat (BTU/hr)
- = Change in humidity ratio (lb/lb)
Total Heat:
- Combines sensible and latent heat.
Tips and Hacks for Using the Psychrometric Chart
- Mark Common Points: Use highlighters or digital tools to mark frequently used conditions (e.g., summer vs. winter design conditions).
- Leverage Apps: Digital psychrometric calculators simplify plotting points and performing calculations.
- Use Color Codes: Assign different colors to cooling, heating, humidification, and dehumidification zones for clarity.
FAQs
Q1: What is a psychrometric chart?
A: A psychrometric chart is a graphical representation of the physical and thermal properties of moist air. It shows relationships between temperature, humidity, and other air properties.
Q2: What are the 8 processes of the psychrometric chart?
A: The 8 processes include sensible heating, sensible cooling, humidification, dehumidification, mixing of air streams, evaporative cooling, heating and humidifying, and cooling and dehumidifying.
Q3: What is DBT and WBT in a psychrometric chart?
A: DBT (Dry Bulb Temperature) is the air temperature measured without considering moisture. WBT (Wet Bulb Temperature) is the lowest temperature air can reach through evaporation.
Q4: What is a psychrometer used for?
A: A psychrometer measures DBT and WBT to determine humidity levels.
Q5: What is the principle of psychrometric?
A: Psychrometry is based on the principle of analyzing air properties, focusing on temperature and humidity, to determine comfort and energy efficiency.
Q6: What are the 4 psychrometric processes?
A: The 4 basic processes are sensible heating, sensible cooling, humidification, and dehumidification.
Q7: How to draw a psychrometric chart?
A: Use temperature, humidity, and other air properties to plot points on a graph, connecting them to represent various processes.
Q8: Who made the psychrometric chart?
A: Willis Carrier, the father of modern air conditioning, developed the psychrometric chart.
Q9: How to find dew point?
A: Locate the air’s temperature and RH on the chart, then trace to the dew point temperature line.
Q10: What is the full form of WBT?
A: Wet Bulb Temperature.
Q11: What is ADP in psychometry?
A: ADP (Apparatus Dew Point) is the temperature at which the cooling coil in an air conditioner begins to condense water vapor.
Free Resource: Psychrometric Chart PDF
To enhance your understanding, download our free, high-quality psychrometric chart PDF here. It includes a detailed legend and step-by-step usage guide.
Conclusion
Mastering the psychrometric chart is a game-changer for HVAC professionals. It helps you design efficient systems, manage humidity, and optimize indoor air quality. With the tips, formulas, and free resource provided, you’re well on your way to becoming proficient in using this essential tool.
Take the Next Step
Start applying these insights today, and don’t forget to grab your free psychrometric chart to practice. Let us know in the comments if you have any questions or additional tips to share!